Unlock Your Investing Advantage: Intelligent Stock Comparisons Made Easy.
Valueit streamlines your investment research. Compare company performance across industries and global markets in just a few clicks. Analyze key financial metrics like profitability, efficiency, liquidity, and solvency, all presented in clear visualization
What We Offer
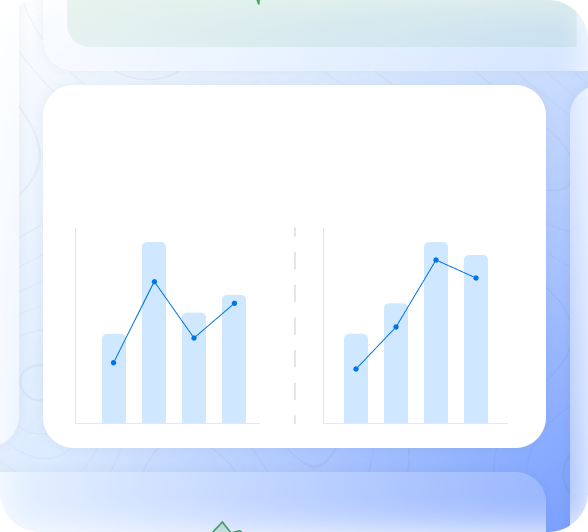
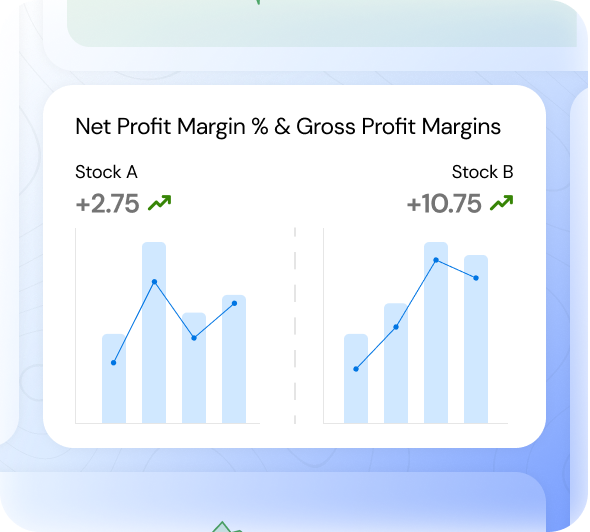
Stock A
+2.75
Stock B
+10.75
Net Profit Margin % & Gross Profit Margins
Stock Comparison
With Valueit, compare any stock on any exchange with just a few clicks. Analyze its performance against benchmarks or peers, all in your preferred currency. Our platform provides pre-built, insightful graphs to simplify fundamental analysis.
Stock Comparison
With Valueit, compare any stock on any exchange with just a few clicks. Analyze its performance against benchmarks or peers, all in your preferred currency. Our platform provides pre-built, insightful graphs to simplify fundamental analysis.
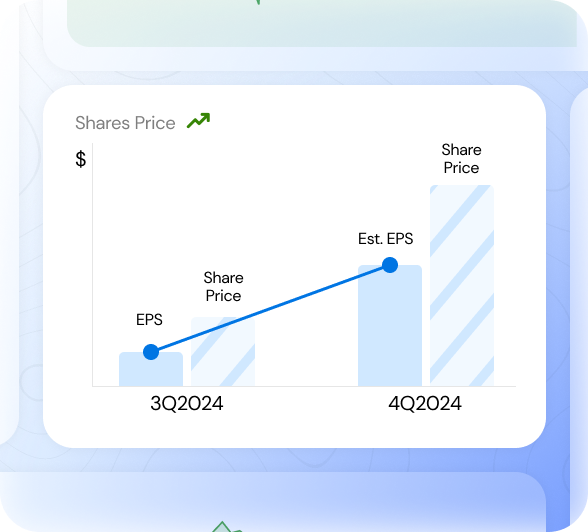
Self Valuation
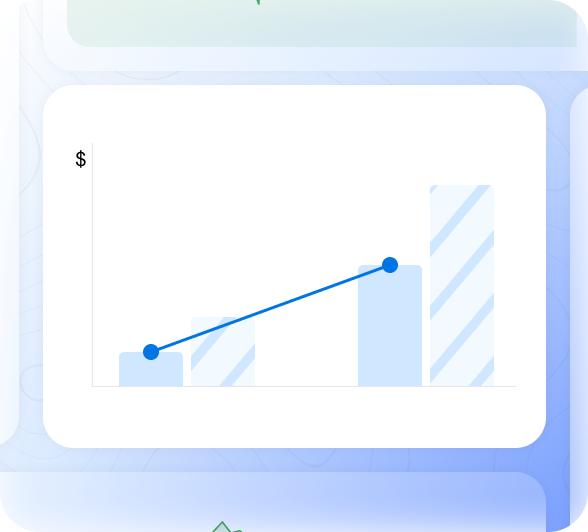
Simply enter your estimated P/E ratio and EPS growth for any stock. Valueit will instantly calculate projected valuations for both your chosen stock and its comparable peers. Gain valuable insights into potential future performance and save time on complex calculations.
Shares Price
Share
Price
EPS
Share
Price
Est. EPS
3Q2024
4Q2024
Self Valuation
Simply enter your estimated P/E ratio and EPS growth for any stock. Valueit will instantly calculate projected valuations for both your chosen stock and its comparable peers. Gain valuable insights into potential future performance and save time on complex calculations.
Net Profit
Net Margins
Working Capital
PE Ratio
Operating Cash
CAPEX
1Q2024
3Q2024
Dynamic Graphs
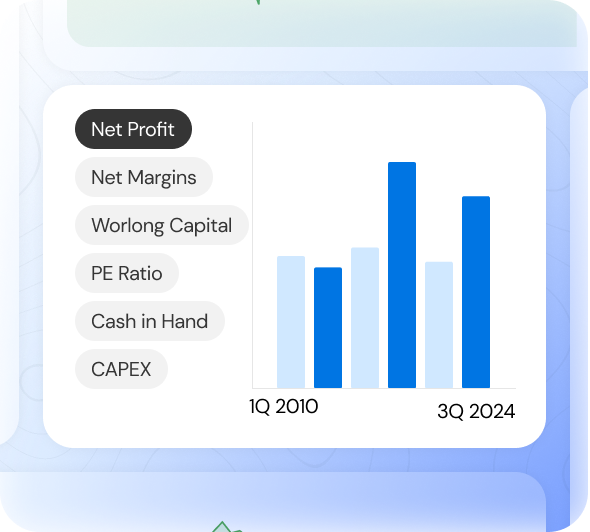
Gain deep insights into company health through analysis of working capital, solvency, and more using Valueit’s interactive charts. Compare stocks globally to identify industry trends and uncover hidden investment opportunities. Make smarter decisions with the power of visual data analysis.
Segmented Visualizations
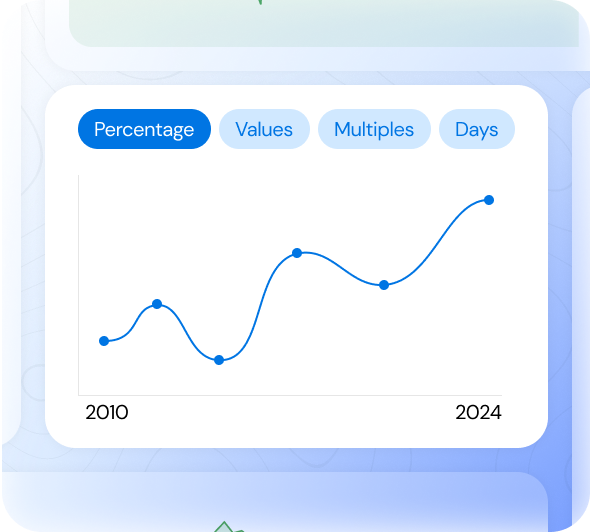
Valueit’s dynamic graphs avoid information overload by cleverly organizing key metrics like percentages, multiples, days, and absolute values in clear sections. This streamlined approach lets investors and analysts quickly grasp the financial health of multiple companies at a glance.
Percentage
Values
Multiples
Days
2010
2024
Segmented Visualizations
Valueit’s dynamic graphs avoid information overload by cleverly organizing key metrics like percentages, multiples, days, and absolute values in clear sections. This streamlined approach lets investors and analysts quickly grasp the financial health of multiple companies at a glance.
How it Works
Valueit, where fundamental analysis meets intelligent investing. Make informed investment choices. Uncover a company's true value with our analysis tools.
Pricing Plans
Get started with our free plan, providing a wealth of essential information to support your investment decision-making.
0$
/month
Intermediate
- 5 Years of Financial Data
- Compare Multiple Stocks at once
- Self Valuation
- Dynamic Graphs
- AI Driven Stock Recommendations
- Qatar & Colombo Stock Exchange
Testimonials


Blog

Unveiling the Timeless Art of Value Investing: A Journey through P/E Multiples and Fundamental Analysis
In the ever-evolving landscape of investing, where trends flicker like candle flames in the wind, one philosophy stands the test of time: value investing. Rooted in the

Investing in Low P/E Stocks
In the world of investing, the Price-to-Earnings (P/E) ratio is a fundamental metric used to

Mastering Working Capital
Efficient working capital management is crucial for any business, big or small. It


